Condensate Removal

Contents
The Stall Chart - Constant Flow Secondary - Varying Inlet Temperature - Constant Outlet Temperature
Using a chart to calculate stall for a constant secondary flowrate with a varying outlet temperature.
- Constant Flowrate
- Constant Inlet Temperature
- Varying Outlet Temperature
The Stall Chart - Constant Flowrate/Varying Outlet Temperature
All systems discussed up to this point assume that the secondary fluid outlet temperature remains constant. In some applications, the outlet temperature may change with time. This will also change the heat load and affect the stall point.
Such changes often occur in process applications, and also heating calorifiers that change their outlet temperature to compensate for changes in ambient conditions.
If the highest heat requirement occurs when the control temperature (the set point) is at a maximum, any reduction in the set point will cause a reduction in the heat load.
A reducing set point will tend to increase the stall load, as shown in the following calculations.
Once the design conditions are known, the effect of reducing the set point can either be calculated mathematically as shown below or illustrated on a stall chart by means of proportionality.
Example 13.7.1
Initially, secondary water at a rate of 1.5 L/s enters a heat exchanger at 20°C and leaves at 70°C.
It is observed via a pressure gauge on the steam inlet that the pressure in the steam space under these conditions is 5.2 bar g (TS = 160°C). The condensate drains down to a vented receiver in a plant room below the installation. (T(back) = 100°C).
If the set point is reduced to 60°C, what is the effect on the stall point and the steam load at stall?
Calculating the effect of reducing the set point arithmetically
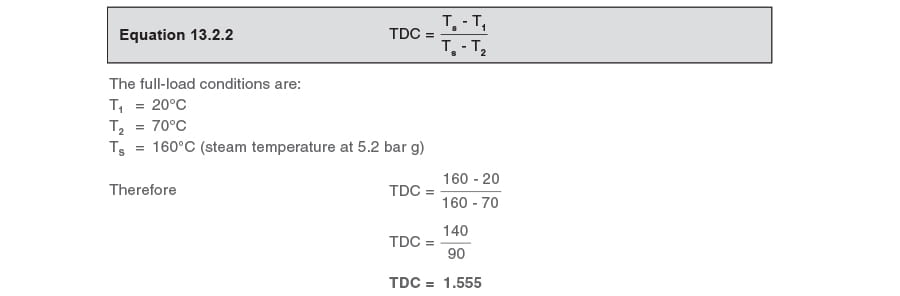
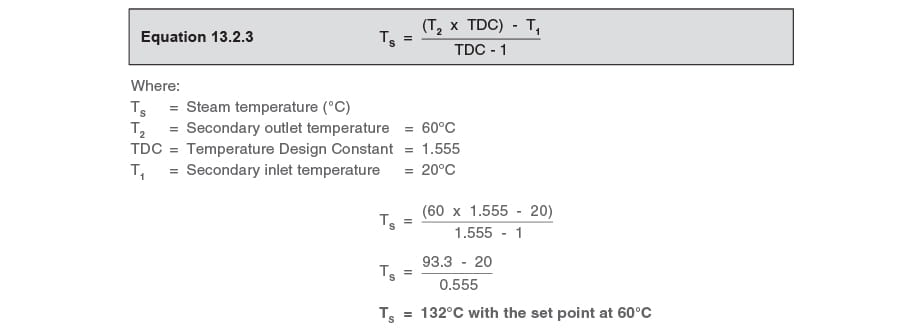
It is first necessary to establish the heat exchanger TDC from the full-load operating conditions and by use of Equation 13.2.2:
How does the stall load change with a lowered set point?
Firstly, consider the stall load with the higher set point of 70°C
The design conditions are:
T1 = 20°C
T2 = 70°C
TS = 160°C
T(back) = 100°C
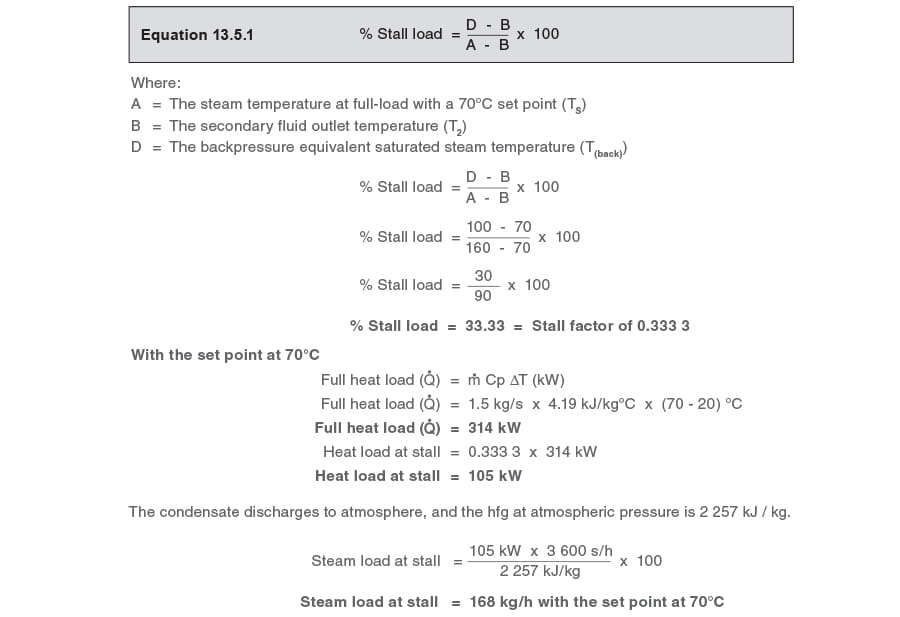
For a constant secondary flowrate, the stall factor can be calculated from Equation 13.5.1:
Secondly, consider the stall load with the lower set point of 60°C
The steam temperature can be predicted for any load by use of Equation 13.2.3:
At the reduced set point of 60°C, the stall factor can again be calculated by use of Equation 13.5.1:
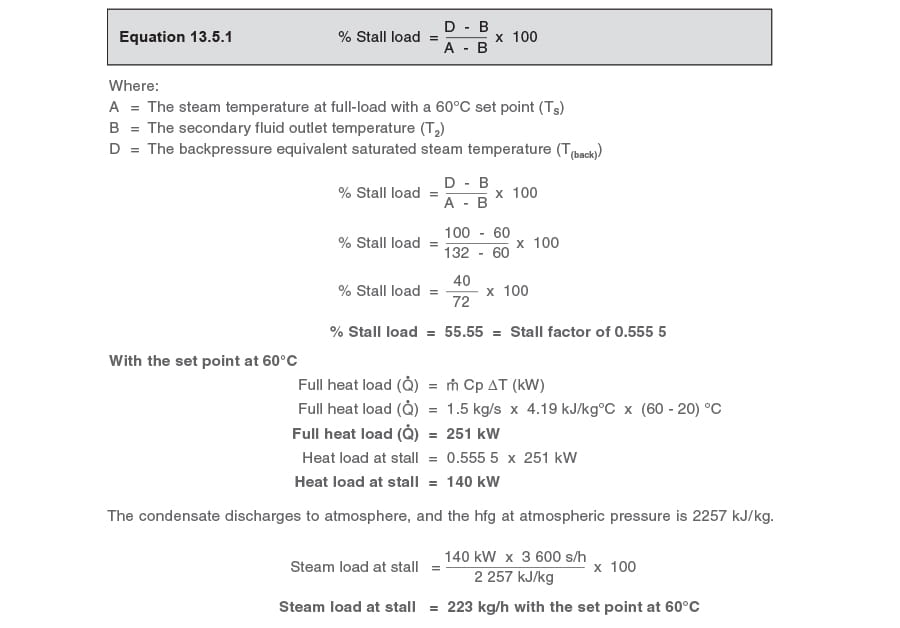
It can be seen from the above calculations that when the set point is reduced from 70°C to 60°C, the stall load increases from 168 kg / h to 223 kg / h.
It is therefore important that if the application is such that the set point will be reduced, the trapping device, i.e. ball float steam trap or pump-trap, is selected on the stall condition at the lower set point.
Illustrating the effect of reducing the set point by the stall chart method
The stall chart in Figure 13.7.1 shows the secondary temperature line CB and the corresponding steam line AB for this application (Example 13.7.1) with the higher set point of 70°C.
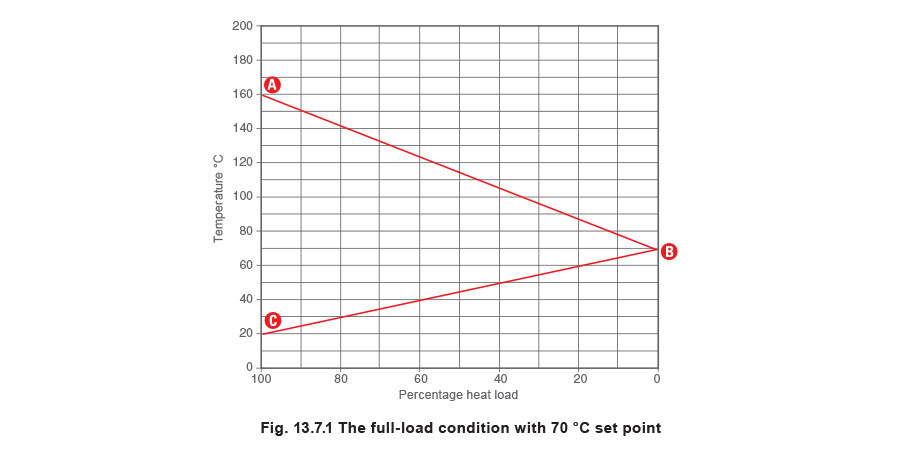
As mentioned at the beginning of this module, once the operating conditions are known, the effect of reducing the set point can be illustrated on the stall chart by means of proportionality.
This is shown in Figure 13.7.2 by marking the reduced secondary outlet temperature of 60°C (Point D) on the secondary load line CB and drawing a line ED parallel to, and below, the dotted steam line AB.
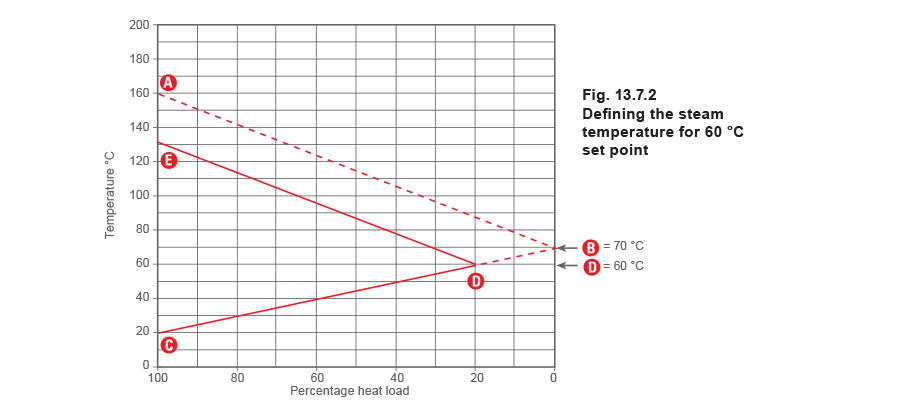
It is observed that the new steam line DE cuts the left hand side of the stall chart at 132°C (Point E), and this is the steam temperature when the set point is reduced to 60°C, for a constant secondary flowrate. The steam line DE represents steam temperature for reducing heat loads when the set point is 60°C.
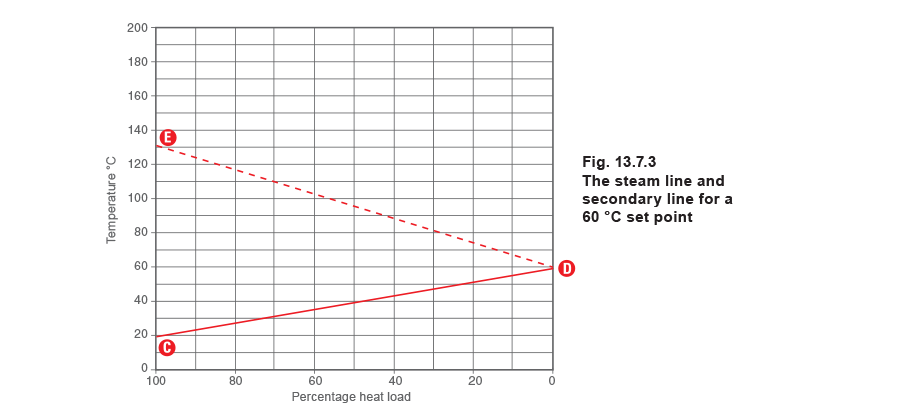
Once the new steam temperature of 132°C has been established, it is possible to draw the new steam line DE from 132°C to 60°C and the secondary temperature line CD from 20°C to 60°C. This stall chart, Figure 13.7.3, represents the steam and secondary inlet temperatures when the set point is at 60°C, consequently zero load now occurs on this stall chart when the secondary temperature is 60°C.
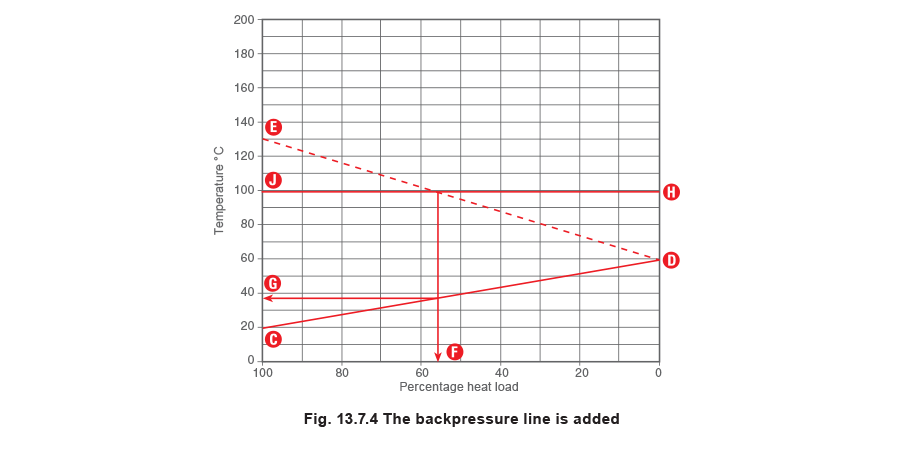
By superimposing the backpressure line of 100°C (line HJ) onto Figure 13.7.4 it is now possible to depict the new stall load and the corresponding inlet temperature, with a set point of 60°C.
The stall load is approximately 55% (Point F) and the inlet temperature at which stall occurs is approximately 38°C (Point G).
By combining Figure 13.7.1 and Figure 13.7.3, it is now possible to observe how the reduction in the outlet temperature from 70°C to 60°C has affected the stall load. In the stall chart below (Figure 13.7.5), it is possible to draw both steam lines AB (160°C to 70°C) and ED (132°C to 60°C). It can be seen that the backpressure line (JH) cuts the two steam lines in different places. The steam line for the higher heat load (with the 70°C set point) is cut at approximately 33% (Point F1), whilst the part load line (with the 60°C set point) is cut at approximately 55% (Point F2).
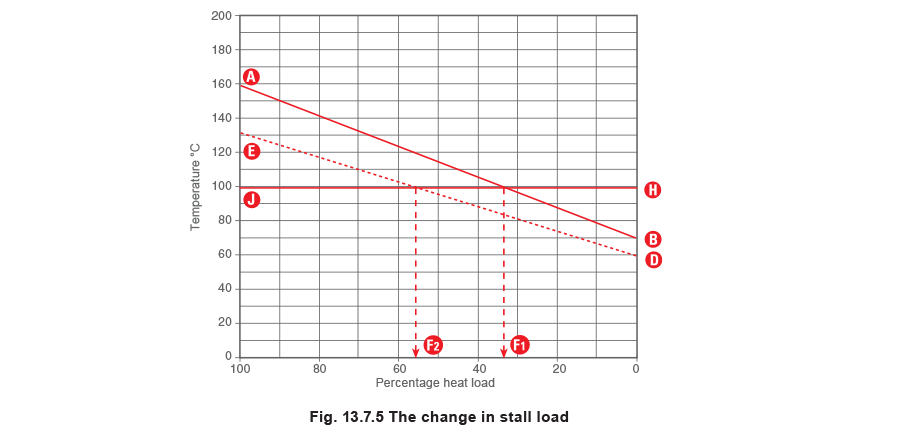
It is important to remember that the above percentages refer to different heat loads. At full-load, the outlet temperature is 70°C and the heat load was calculated in the first part of Example 13.7.1 to be 314 kW, and at the reduced load, when the set point is reduced to 60°C, the heat load was calculated to be 251 kW.
kW.251 kW.
For example
When the set point is 70°C:
The heat load is 314 kW, and stall occurs at 33.33% of this load.

When the set point is 60°C:
The heat load is 251 kW, and stall occurs at 55.55% of this load.

It is observed that the steam load at stall increases as the set point is reduced.
The stall chart can also illustrate the inlet temperatures for both stall conditions. This can be useful when carrying out diagnostics on heat exchangers with stall problems. In the stall chart below (Figure 13.7.6), it can be seen how the inlet temperatures can be observed for each of the stall conditions.
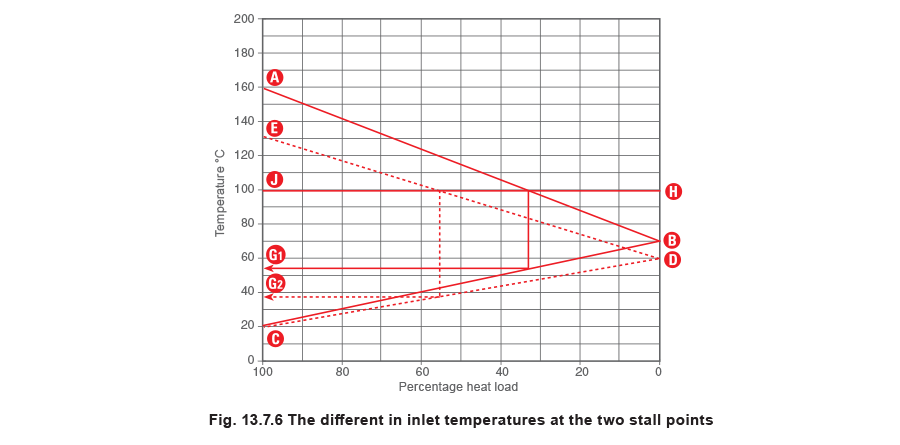
With the 70°C set point, an inlet temperature above 53°C (Point G1) will produce a stall.
With the 60°C set point, an inlet temperature above 38°C (Point G2) will produce a stall.
The validity of these figures can be confirmed by use of the calculation method - Equation 13.2.4:

At the higher set point, T2 = 70°C
T1 = 100 - [1.555 (100 - 70)]
T1 = 100 - [1.555 (30)]
T1 = 100 - 46.7
T1 = 53.3°C46.7
At the lower set point, T2 = 60°C
T1 = 100 - [1.555 (100 - 60)]
T1 = 100 - [1.555 (40)]
T1 = 100 - 62.2
T1 = 37.8°C62.2
Summary
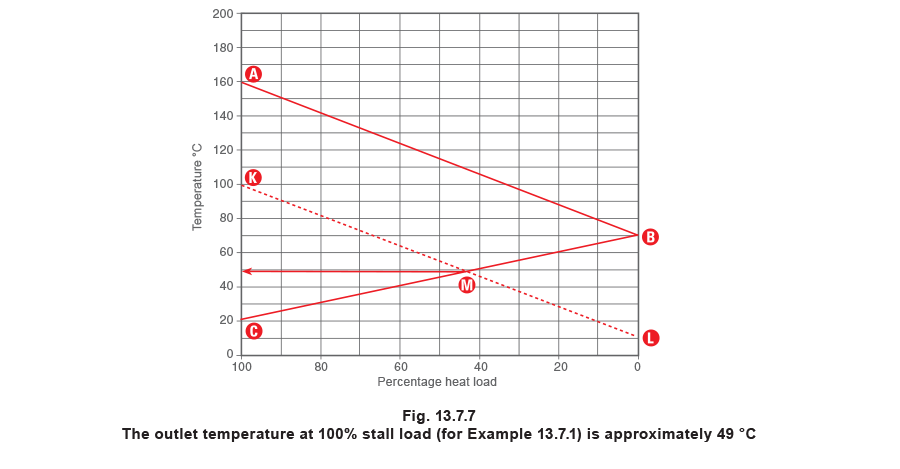
It can be seen from the above information that the stall load will increase as a result of a reducing set point. In fact, stall load will continue to increase to a maximum until the steam pressure falls to equal the condensate backpressure. It is also possible to predict the set point at, and below which permanent stall occurs. The effect can be predicted in the stall chart below (Figure 13.7.7). Stall occurs when the steam temperature is the same as the condensate backpressure, which, in this example, is 100°C, (Point K).
In Figure 13.7.7 it is possible to predict the outlet temperature at 100% stall, by projecting the steam temperature line from 100°C (Point K) parallel to the full-load steam line AB, creating line (KL). Where the new steam line KL cuts the secondary load line BC at point M, the outlet temperature can be observed, to be approximately 49°C. If the set point is reduced to (or below) 49°C, stall would be permanent for this example.
Selecting the correct trapping device
The object of predicting steam pressures and their corresponding steam loads is to enable the selection of the correct trapping device for any application.
In this instance, the trapping device would be selected on the following information.
A ball float steam trap can be specified if it meets the following two criteria satisfying the initial brief in Example 13.7.1:-
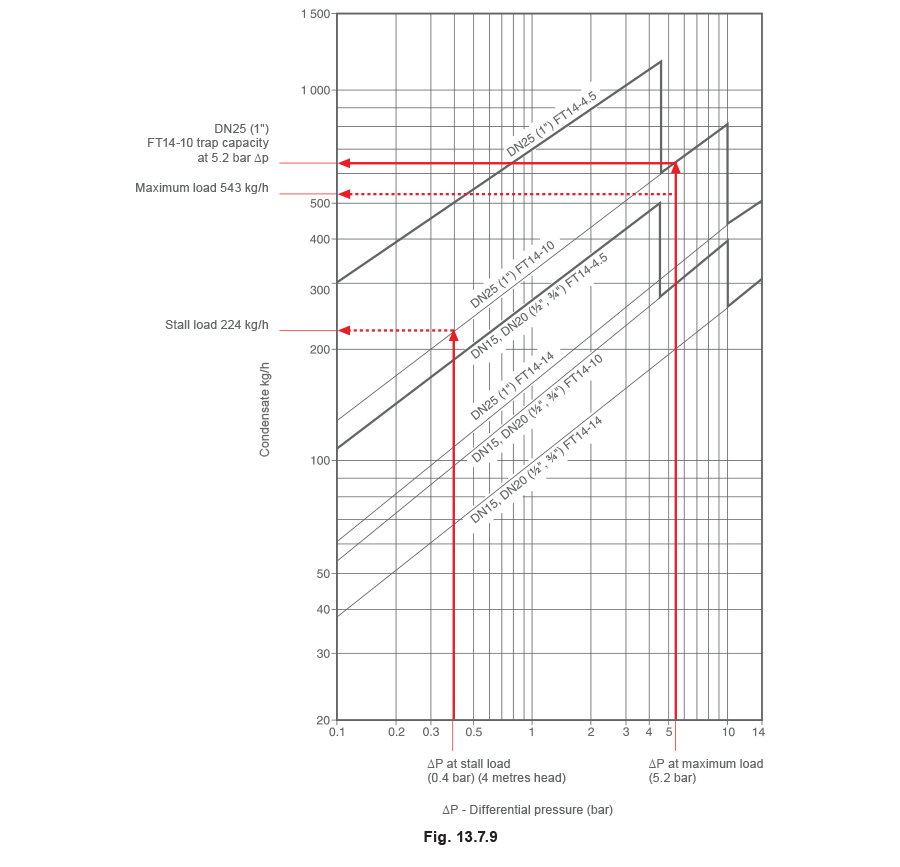
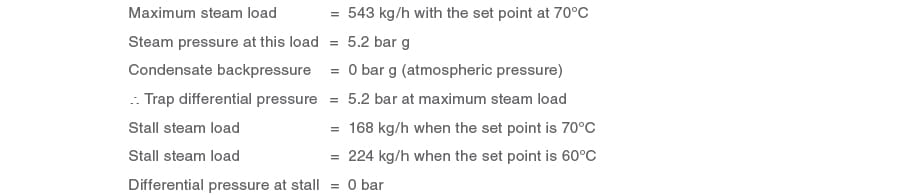
- It can pass the full-load condition, i.e. 543 kg / h at 5.2 bar differential pressure
- It can pass the maximum stall load, i.e. 224 kg / h at the 60°C set point
Creating a static head above the ball float steam trap
At the stall condition, with the steam pressure inside the heat exchanger equalling the backpressure, a differential pressure would not exist to push the condensate through a ball float steam trap. Because of this, pressure has to be manufactured on the upstream side of the trap by means of a static head.
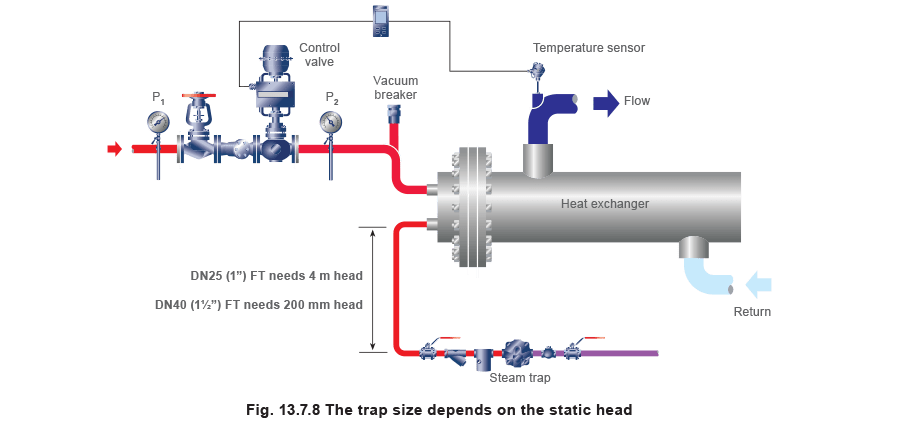
Static head must be available between the heat exchanger condensate outlet and the trap inlet to generate enough differential pressure to enable the trap to pass the stall load of 224 kg / h. In order to allow condensate to drain easily from the exchanger, a vacuum breaker is fitted to its steam inlet downstream of the control valve (Figure 13.7.8).
It can be seen in Figure 13.7.9 that a DN25 (1") FT10-10 ball float steam trap will accommodate these criteria. However, the trap requires a minimum of 4 metres head above the trap inlet to pass the stall load.
A 4 metre head might not be available in practice, and, if so, a larger trap would need to be specified. Refer to Figure 13.7.8.
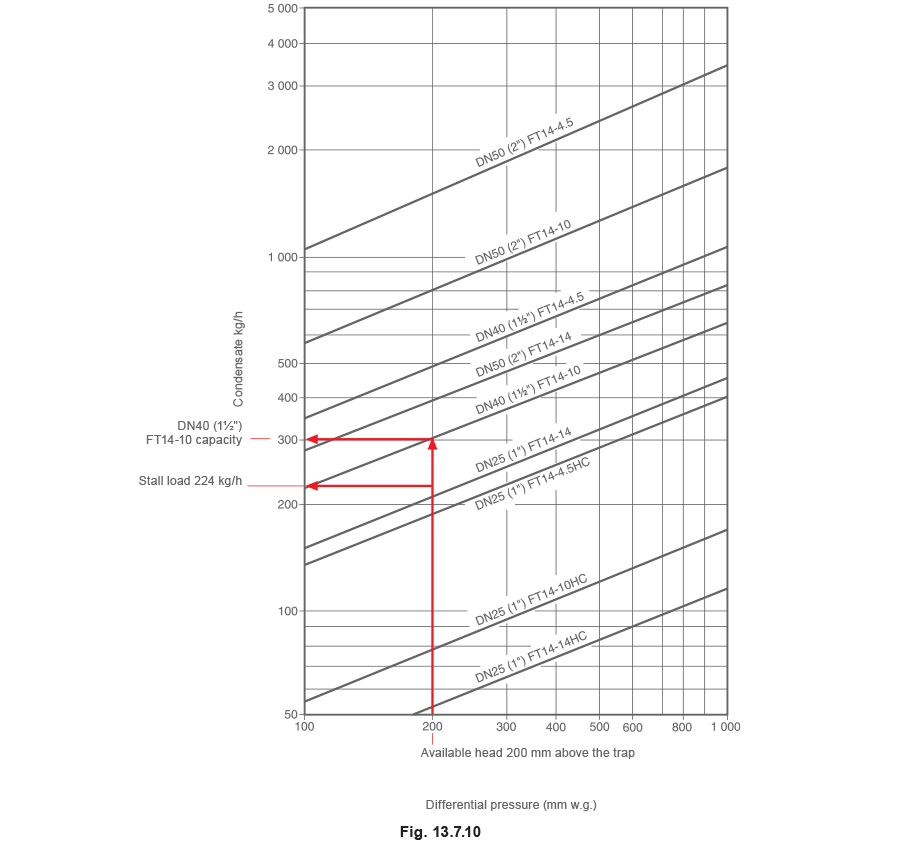
For the purposes of Example 13.7.1, if the available head were only 200 mm then it can be seen from Figure 13.7.10 that a DN40 (1½") FT10-10 ball float steam trap would be required.
Should the backpressure have been greater than atmospheric pressure, due perhaps to a lift after the trap and/ or a pressurised condensate line, then the same sizing routine could be carried out. Depending upon the amount of backpressure, it may be that even the largest sized steam trap cannot pass the required amount of condensate at stall.
Under these circumstances, a ball float steam trap cannot be specified, as the heat exchanger will flood at part loads. Instead, a pump-trap must be used, which is able to clear the condensate from the heat exchanger into the condensate system at any heat load.