Flowmetering

Contents
Instrumentation
Apparatus for accurate steam flow measurement, including differential pressure cells and data collection & analysis equipment. Also covers special considerations such as the effects of pressure variation, steam dryness fraction and superheat.
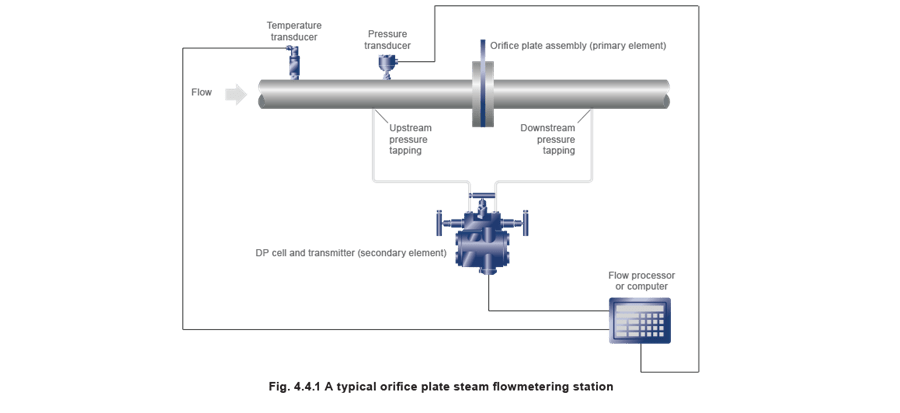
A steam flowmeter comprises two parts:
1. The ‘primary’ device or pipeline unit, such as an orifice plate, located in the steam flow.
2. The ‘secondary’ device, such as a differential pressure cell, that translates any signals into a usable form.
In addition, some form of electronic processor will exist which can receive, process and display the information. This processor may also receive additional signals for pressure and/or temperature to enable density compensation calculations to be made.
Figure 4.4.1 shows a typical system.
Differential pressure cells (DP cells)
If the pipeline unit is a differential pressure measuring device, for example an orifice plate flowmeter or Pitot tube, and an electronic signal is required, the secondary device will be a Differential Pressure (DP or ΔP) cell. This will change the pressure signal to an electrical signal. This signal can then be relayed on to an electronic processor capable of accepting, storing and processing these signals, as the user requires.

A typical DP cell is an electrical capacitance device, which works by applying a differential pressure to either side of a metal diaphragm submerged in dielectric oil. The diaphragm forms one plate of a capacitor, and either side of the cell body form the stationary plates. The movement of the diaphragm produced by the differential pressure alters the separation between the plates, and alters the electrical capacitance of the cell, which in turn results in a change in the electrical output signal.
The degree of diaphragm movement is directly proportional to the pressure difference.
The output signal from the measuring cell is fed to an electronic circuit where it is amplified and rectified to a load-dependent 4-20 mA dc analogue signal. This signal can then be sent to a variety of devices to:
- Provide flowrate indication
- Be used with other data to form part of a control signal.
The sophistication of this apparatus depends upon the type of data the user wishes to collect.
Advanced DP cells
The advancement of microelectronics, and the pursuit of increasingly sophisticated control systems has led to the development of more advanced differential pressure cells. In addition to the basic function of measuring differential pressure, cells can now be obtained which:
- Can indicate actual (as distinct from differential) pressure.
- Have communication capability, for example HART® or Fieldbus.
- Have self-monitoring or diagnostic facilities.
- Have ‘on-board’ intelligence allowing calculations to be carried out and displayed locally.
- Can accept additional inputs, such as temperature and pressure.
Data collection
Many different methods are available for gathering and processing of this data, these include:
- Dedicated computers.
- Stand alone PLCs (Programmable Logic Controller systems).
- Centralised DCSs (Distributed Control Systems).
- SCADAs (Supervisory Control And Data Acquisition systems)
One of the easier methods for data collection, storage, and display is a dedicated computer. With the advent of the microprocessor, extremely versatile flow monitoring computers are now available.
The display and monitoring facilities provided by these can include
- Current flowrate.
- Total steam usage.
- Steam temperature/pressure.
- Steam usage over specified time periods.
- Abnormal flowrate, pressure or temperature, and trigger remote alarms.
- Compensate for density variations
- Interface with chart recorders.
- Interface with energy management systems.
Some can more accurately be termed energy flowmeters since, in addition to the above variables, they can use time, steam tables, and other variables to compute and display both the power (kW or Btu/h) and heat energy usage (kJ or Btu).
In addition to the computer unit, it is sometimes beneficial to have a local readout of flowrate.
Data analysis
Data collection, whether it is manual, semi-automatic or fully automatic, will eventually be used as a management tool to monitor and control energy costs. Data may need to be gathered over a period of time to give an accurate picture of the process costs and trends. Some production processes will require data on a daily basis, although the period often preferred by industrial users is the production week.Microcomputers with software capable of handling statistical calculations and graphics are commonly used to analyse data. Once the measuring system is in place, the first objective is to determine a relationship between the process (for example tonnes of product/hour) and energy consumption (for example kg of steam/hour). The usual means of achieving this is to plot consumption (or specific consumption) against production, and to establish a correlation. However, some caution is required in interpreting the precise nature of this relationship. There are two main reasons for this:
- Secondary factors may affect energy consumption levels.
- Control of primary energy use may be poor, obscuring any clear relationship.
Statistical techniques can be used to help identify the effect of multiple factors. It should be noted that care should be taken when using such methods, as it is quite easy to make a statistical relationship between two or more variables that are totally independent.
Once these factors have been identified and taken into account, the standard energy consumption can then be determined. This is the minimum energy consumption that is achievable for the current plant and operating practices.
The diagram in Figure 4.4.3 plots a typical relationship between production and consumption.
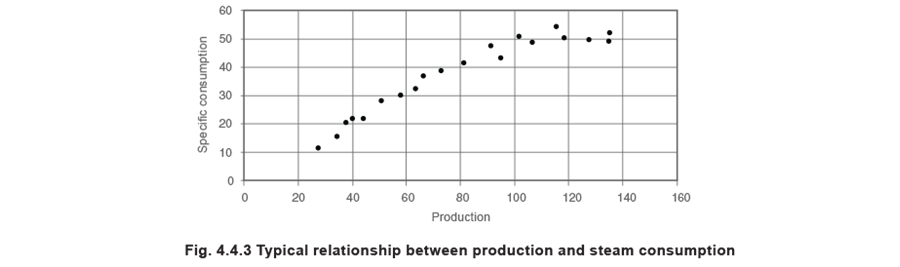
Once the relationship between steam consumption and factory production has been established, it becomes the basis/standard to which all future production can be measured.
Using the standard, the managers of individual sections can then receive regular reports of their energy consumption and how this compares to the standard. The individual manager can then analyse his/her plant performance by asking:
- How does consumption compare with the standard?
- Is the consumption above or below the standard, and by how much does it vary?
- Are there any trends in the consumption?
If there is a variation in consumption it may be for a number of reasons, including:
- Poor control of energy consumption.
- Defective equipment, or equipment requiring maintenance.
- Seasonal variations.
To isolate the cause, it is necessary to first check past records, to determine whether the change is a trend towards increased consumption or an isolated case. In the latter case, checks should then be carried out around the plant for leaks or faulty pieces of equipment. These can then be repaired as required.
Standard consumption has to be an achievable target for plant managers, and a common approach is to use the line of best fit based on the average rather than the best performance that can be achieved (see Figure 4.4.4).
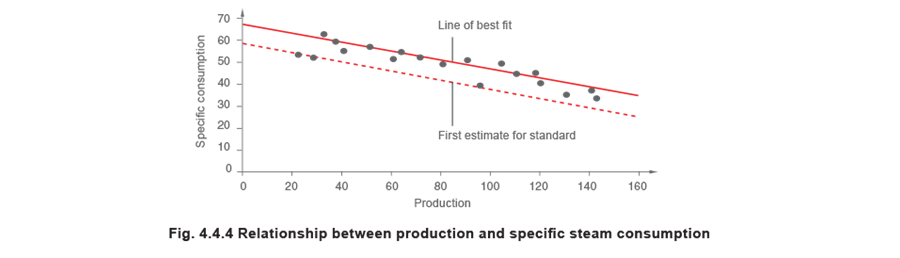
Once the standard has been determined, this will be the new energy consumption datum line.
This increase in energy consciousness will inevitably result in a decrease in energy costs and overall plant running costs, consequently, a more energy efficient system.
Special requirements for accurate steam flow measurement
As mentioned earlier in Block 4, flowmeters measure velocity; additional values for cross sectional area (A) and density (P) are required to enable the mass flowrate (qm) to be calculated. For any installation, the cross sectional area will remain constant, the density (P) however will vary with pressure and dryness fraction.
The next two sections examine the effect of pressure and dryness fraction variation on the accuracy on steam flowmeter installations.
Pressure variation
In an ideal world, the pressure in process steam lines would remain absolutely constant. Unfortunately, this is very rarely the case with varying loads, boiler pressure control dead-bands, frictional pressure losses, and process parameters all contributing to pressure variations in the steam main.
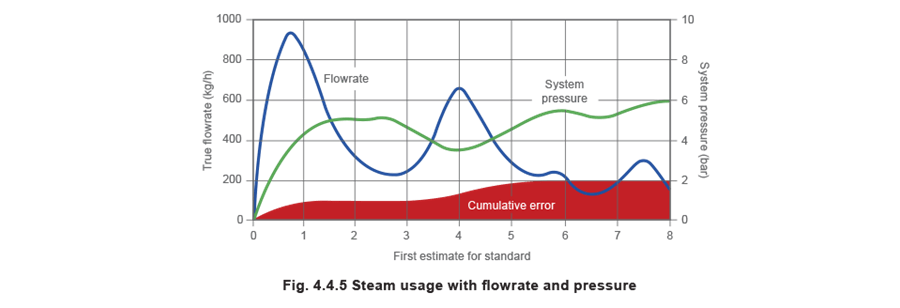
Figure 4.4.5 shows the duty cycle for a saturated steam application. Following start-up, the system pressure gradually rises to the nominal 5 bar g but due to process load demands the pressure varies throughout the day. With a non-pressure compensated flowmeter, the cumulative error can be significant.
Some steam flowmetering systems do not have inbuilt density compensation, and are specified to operate at a single, fixed line pressure. If the line pressure is actually constant, then this is acceptable. However, even relatively small pressure variations can affect flowmeter accuracy. It may be worth noting at this point that different types of flowmeter may be affected in different ways.
Velocity flowmeters
The output signal from a vortex shedding flowmeter is a function of the velocity of flow only. It is independent of the density, pressure and temperature of the fluid that it is monitoring. Given the same flow velocity, the uncompensated output from a vortex shedding flowmeter is the same whether it is measuring 3 bar g steam, 17 bar g steam, or water.
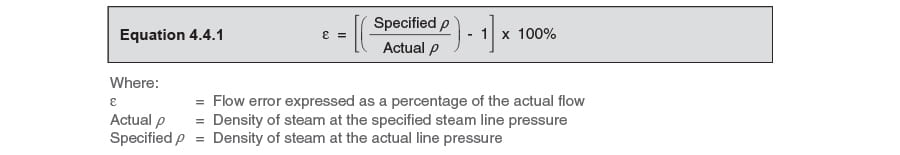
Flow errors, therefore are a function of the error in density and may be expressed as shown in Equation 4.4.1.
Example 4.4.1
As a basis for the following examples, determine the density (ρ) of dry saturated steam at 4.2 bar g and 5.0 bar g.

Example 4.4.2
A vortex shedding steam flowmeter specified to be used at 5 bar g is used at 4.2 bar g. Use Equation 4.4.1 and the data from Example 4.4.1 to determine the resulting error (ε).

Therefore, the uncompensated vortex flowmeter will over read by 14.42%
As one of the characteristics of saturated steam (particularly at low pressures up to about 6 bar g) is that the density varies greatly for a small change in pressure, density compensation is essential to ensure accurate readings.
Equation 4.4.1 may be used to generate a chart showing the expected error in flow for an error in pressure, as shown in Figure 4.4.6.
Differential pressure flowmeters
The output signal from an orifice plate and cell takes the form of a differential pressure signal. The measured mass flowrate is a function of the shape and size of the hole, the square root of the differential pressure and the square root of the density of the fluid. Given the same observed differential pressure across an orifice plate, the derived mass flowrate will vary with the square root of the density.
As for vortex flowmeters, running an orifice plate flowmeter at a pressure other than the specified pressure will give rise to errors.
The percentage error may be calculated using Equation 4.4.2.

Example 4.4.3.
An orifice plate steam flowmeter specified to be used at 5 bar g is used at 4.2 bar g. Use Equation 4.4.2 to determine the resulting percentage error (ε).

The positive error means the flowmeter is overreading, in this instance, for every 100 kg of steam passing through, the flowmeter registers 106.96 kg.
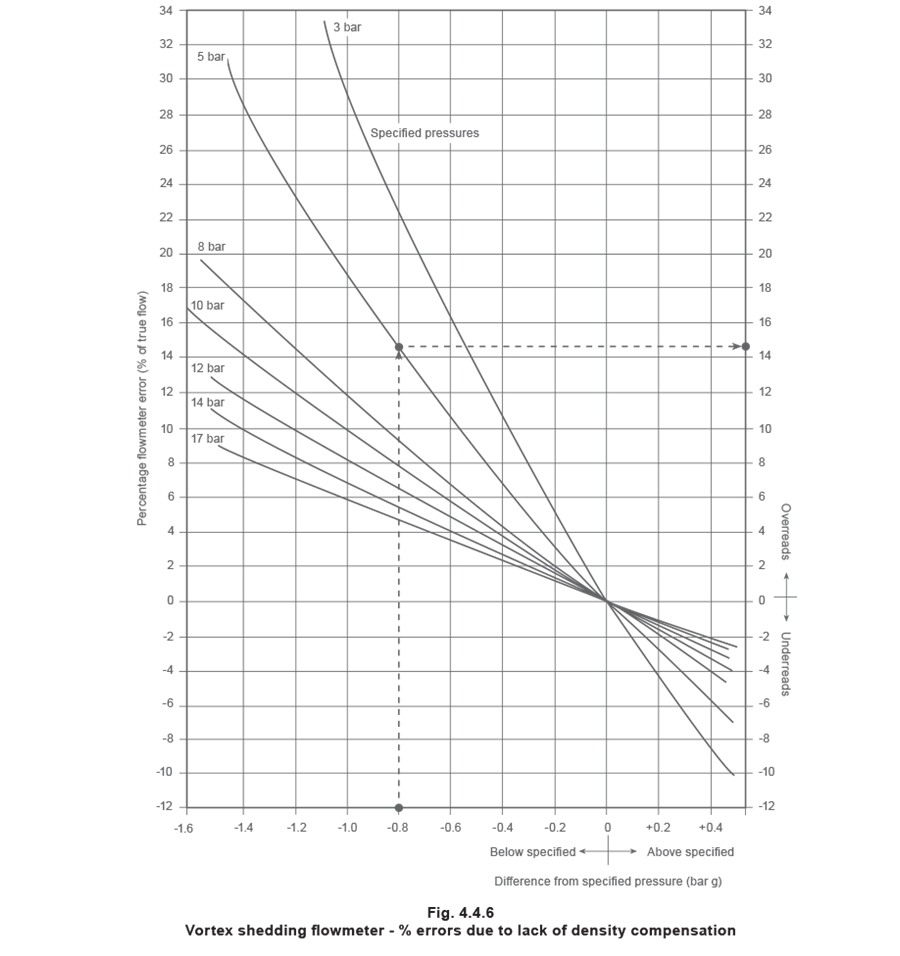
Equation 4.4.2 may be used to generate a chart showing the expected error in flow for an error in pressure, as shown in Figure 4.4.7.
When comparing Figure 4.4.6 with Figure 4.4.7, it can be seen that the % error due to lack of density compensation for the vortex flowmeter is approximately double the % error for the orifice plate flowmeter. Therefore, density compensation is essential if steam flow is to be measured accurately. If the steam flowmeter does not include an inbuilt density compensation feature then extra pressure and/or temperature sensors must be provided, linked back to the instrumentation system.
Dryness fraction variation
The density of a cubic metre of wet steam is higher than that of a cubic metre of dry steam. If the quality of steam is not taken into account as the steam passes through the flowmeter, then the indicated flowrate will be lower than the actual value.
Dryness fraction (χ)has already been discussed in Module 2.2, but to reiterate; dryness fraction is an expression of the proportions of saturated steam and saturated water. For example, a kilogram of steam with a dryness fraction of 0.95, contains 0.95 kilogram of steam and 0.05 kilogram of water.
Example 4.4.4
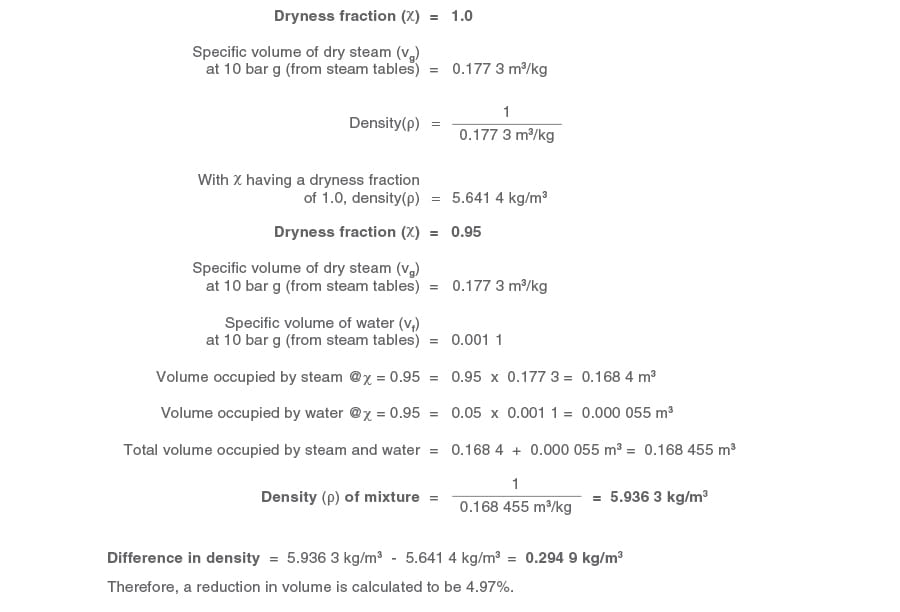
As a basis for the following examples, determine the density (ρ) of dry saturated steam at 10 bar g with dryness fractions of 1.0 and 0.95.
The effect of dryness fraction on flowmeters that measure differential pressure
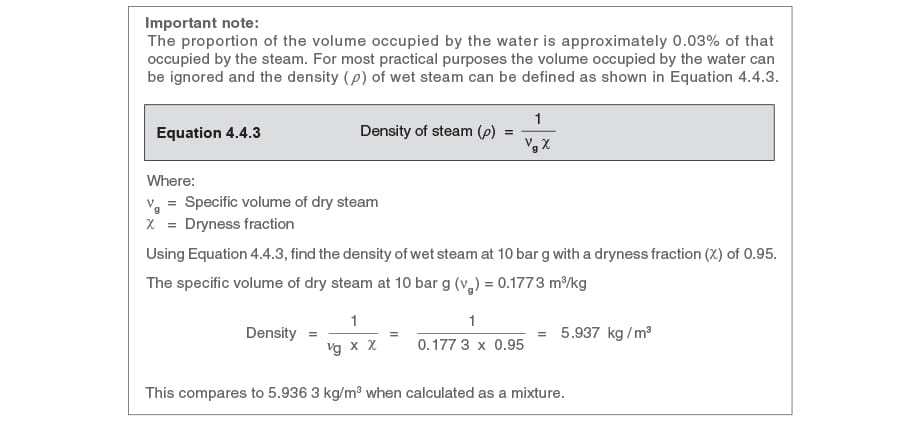
To reiterate earlier comments regarding differential pressure flowmeter errors, mass flowrate (qm) will be proportional to the square root of the density (ρ), and density is related to the dryness fraction. Changes in dryness fraction will have an effect on the flow indicated by the flowmeter. Equation 4.4.4 can be used to determine the relationship between actual flow and indicated flow:

All steam flowmeters will be calibrated to read at a pre-determined dryness fraction (), the typically value is 1. Some steam flowmeters can be recalibrated to suit actual conditions.
Example 4.4.5
Using the data from Example 4.4.4, determine the percentage error if the actual dryness fraction is 0.95 rather than the calibrated value of 1.0, and the steam flowmeter was indicating a flowrate of 1 kg/s.
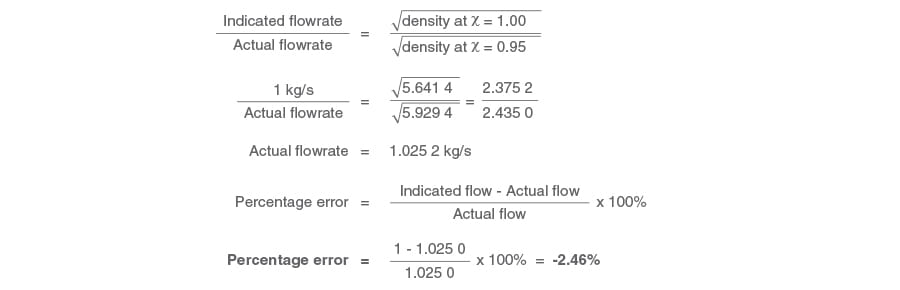
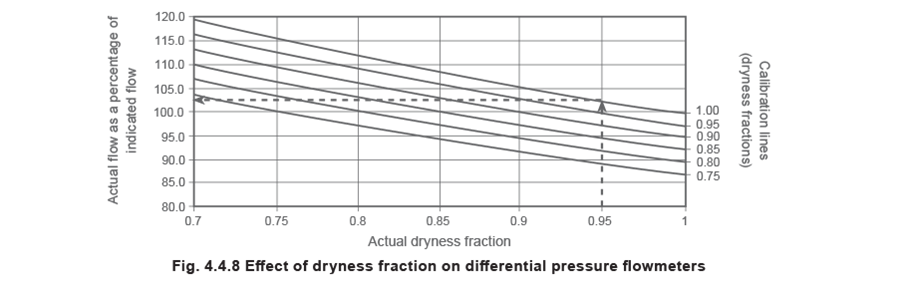
Therefore, the negative sign indicates that the flowmeter under-reads by 2.46%. Equation 4.4.4 is used to compile the graph shown in Figure 4.4.8.
The effect of dryness fraction on vortex flowmeters
It can be argued that dryness fraction, within sensible limitations, is of no importance because:
- Vortex flowmeters measure velocity.
- The volume of water in steam with a dryness fraction of, for example, 0.95, in proportion to the steam is very small.
- It is the condensation of dry steam that needs to be measured.
However, independent research has shown that the water droplets impacting the bluff body will cause errors and as vortex flowmeters tend to be used at higher velocities, erosion by the water droplets is also to be expected. Unfortunately, it is not possible to quantify these errors.
Conclusion
Accurate steam flowmetering depends on:
- Taking pressure variations into account - Pressure will vary in any steam system, and it is clearly futile to specify a flowmeter with an accuracy of ±2% if pressure variations alone can give errors of ±10%. The steam flowmetering package must include density compensation.
- Predictable dryness fraction - Measurement of dryness fraction is very complex; a much easier and better option is to install a steam separator prior to any steam flowmeter. This will ensure that the dryness fraction is always close to 1.0, irrespective of the condition of the steam supplied.
Superheated steam
With saturated steam there is a fixed relationship between steam pressure and steam temperature. Steam tables provide detailed information on this relationship. To apply density compensation on saturated steam, it is only necessary to sense either steam temperature or steam pressure to determine the density (). This signal can then be fed, along with the flow signal, to the flow computer, where, assuming the computer contains a steam table algorithm, it will then do the calculations of mass flowrate.
However, superheated steam is close to being a gas and no obvious relationship exists between temperature and pressure. When measuring superheated steam flowrates, both steam pressure and steam temperature must be sensed and signalled simultaneously. The flowmeter instrumentation must also include the necessary steam table software to enable it to compute superheated steam conditions and to indicate correct values.
If a differential pressure type steam flowmeter is installed which does not have this instrumentation, a flow measurement error will always be displayed if superheat is present.
This is best shown as an example.
Example 4.4.6
Consider a differential pressure flowmeter fitted with pressure reading equipment, but no temperature reading equipment. The flowmeter thinks that it is reading saturated steam at 10 bar g with its corresponding temperature of 184°C. Unfortunately the steam being measured is superheated with a temperature of 220°C.
Using equation 4.4.2 the error in reading can be calculated based on the lower than anticipated density for superheated steam.
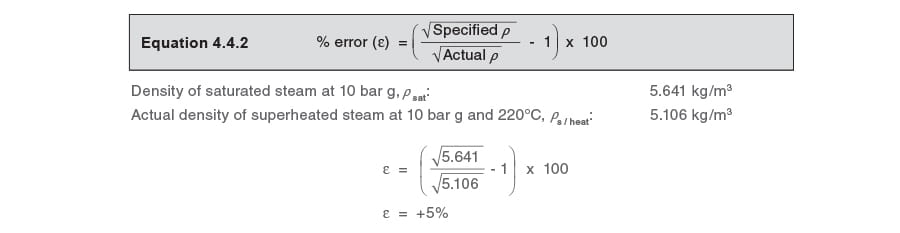
In this case the meter would over read by 5%
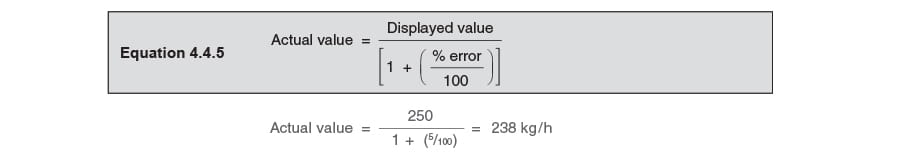
Using the same parameters as example 4.4.6, determine the actual flowrate if the flowmeter displays a flowrate of 250 kg/h.
Equation 4.4.5 can be used to calculate the actual value from the displayed menu.